Gold Price Analysis: XAU/USD wavers above $1,700 despite Friday’s Doji, oversold RSI probe bears
- Gold prints the heaviest gains in a week after candlestick formation, RSI conditions favor corrective pullback.
- Bulls have a long way to go before convincing markets, seven-month-old support line lure bears.
Gold prices pick up bids near $1,708, up 0.57% intraday, while heading into Monday’s European session open. In doing so, the quote extends Friday’s bounce off the nine-month low.
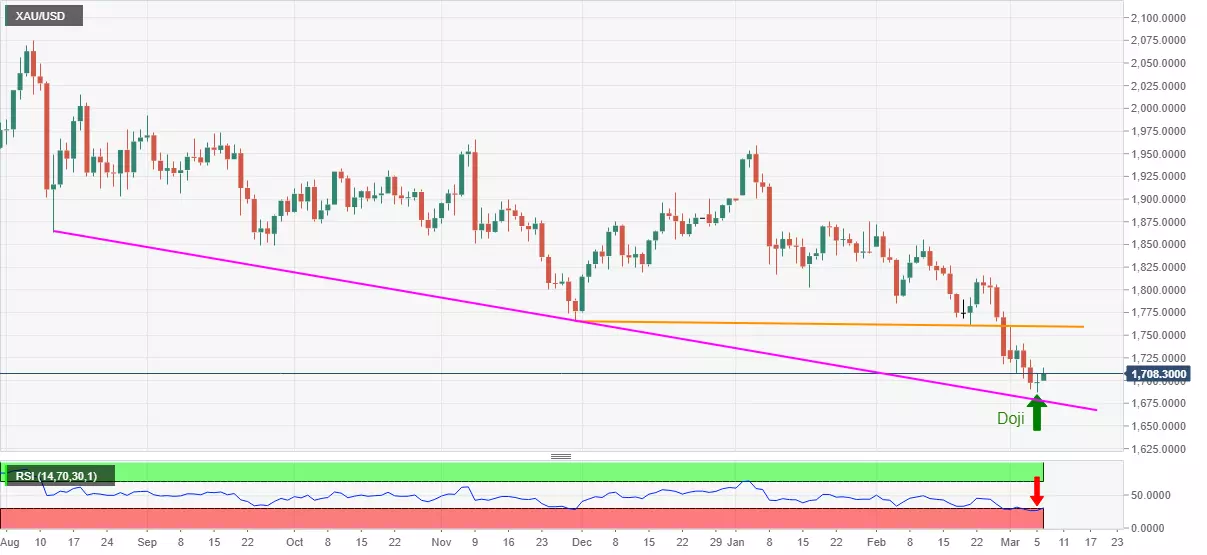
Given the oversold RSI conditions joining hands with Friday’s Doji candlestick pattern, suggesting a trend reversal, gold is up for a further corrective pullback.
However, a descending trend line from November 30, at $1,760 now, will be a tough nut to crack for gold buyers.
Meanwhile, the $1,700 threshold can offer immediate support before directing gold sellers towards a descending trend line from August 12, 2020, at $1,677 now.
If at all gold sellers aren’t tired below $1,677, June 2020 low near $1,670 and January 2020 peak surrounding $1,610 should return to the chart.
To sum up, gold needs to convince buyers but short-term bounce can’t be ruled out.
Gold daily chart
Trend: Further recovery expected