16 Oct 2018
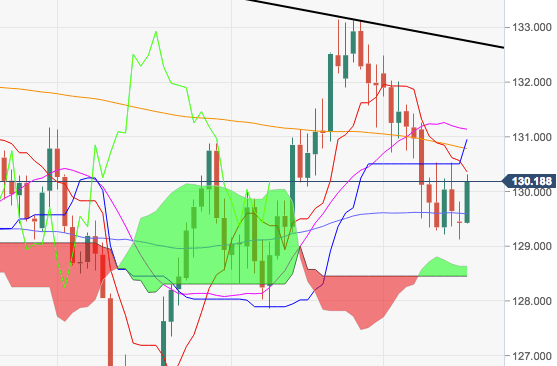
EUR/JPY Technical Analysis: Up move flirts with 10-day SMA at 130.24. Now targets 200-day SMA at 130.77
- The cross is reverting two consecutive daily pullbacks, regaining the 130.00 handle and above while testing at the same time the initial hurdle at the 10-day SMA at 130.24.
- Today’s advance is paving the way for a potential visit to the critical 200-day SMA at 130.77 ahead of the 21-day SMA at 131.16.
- Further up, EUR/JPY should face the next resistance at July’s peaks in the 132.00 neighbourhood.
- However, as long as the cross trades below the resistance line at 132.75, a resumption of the downtrend remains on the cards.
EUR/JPY daily chart
EUR/JPY
Overview:
Last Price: 130.16
Daily change: 73 pips
Daily change: 0.564%
Daily Open: 129.43
Trends:
Daily SMA20: 131.19
Daily SMA50: 129.61
Daily SMA100: 129.43
Daily SMA200: 130.84
Levels:
Daily High: 129.82
Daily Low: 129.12
Weekly High: 131.26
Weekly Low: 129.21
Monthly High: 133.15
Monthly Low: 129.21
Daily Fibonacci 38.2%: 129.39
Daily Fibonacci 61.8%: 129.55
Daily Pivot Point S1: 129.1
Daily Pivot Point S2: 128.77
Daily Pivot Point S3: 128.41
Daily Pivot Point R1: 129.79
Daily Pivot Point R2: 130.15
Daily Pivot Point R3: 130.48