Silver Price Analysis: XAG/USD consolidates as a triple-bottom pattern emerges at hourly chart
- Silver price (XAG/USD) experiences mild losses, lingering below the $21.00 mark amidst a cautious market.
- Technical analysis reveals a consolidation phase, with seven-month-low support at $20.91 and resistance around $21.50.
- Short-term triple-bottom pattern emerges, targeting $22.00, contingent on breaking through several resistance levels.
Silver price (XAG/USD) remains subdued late in the New York session, printing mild losses of 0.35%, below $21.00 per troy ounce after hitting a daily high of $21.29.
The XAG/USD daily chart portrays the white metal in consolidation, capped on the downside by a seven-month-low at around $20.91. On the upside, resistance lies at around $21.50, slightly below a ten-month-old support trendline. A break of those levels could pave the way to test $22.00.
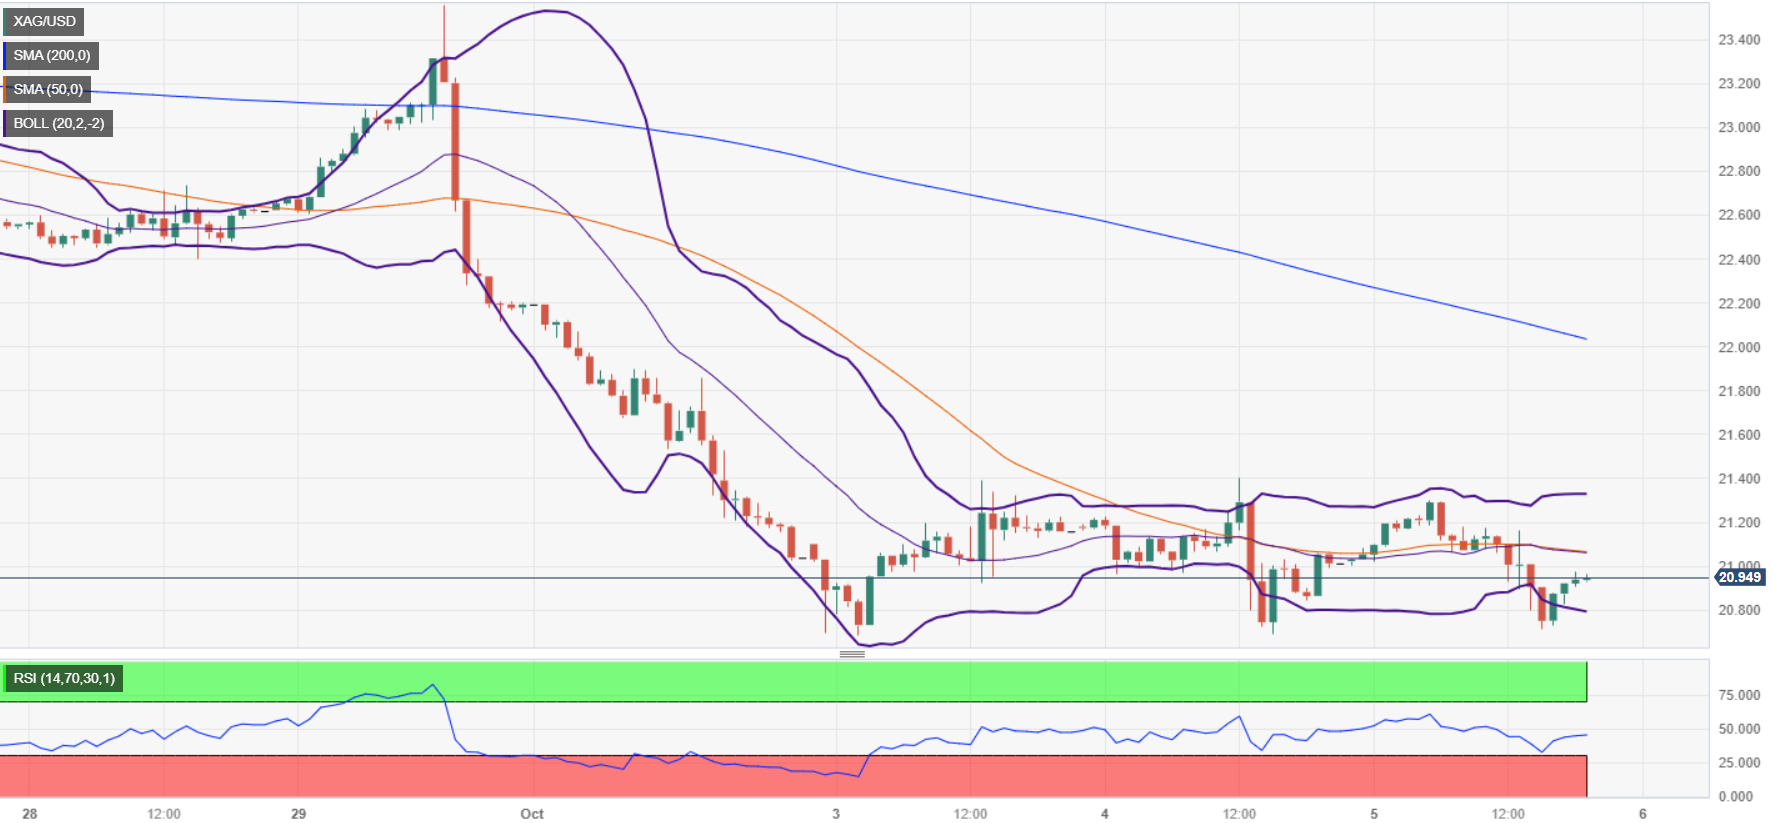
In the short term, the XAG/USD is forming a triple-bottom chart pattern, which would confirm its validity with a break above the October 4 high of $21.39, but on its way towards that price, the non-yielding metal must face solid resistance levels. The first supply zone would be the 20-hour Exponential Moving Average (HEMA) at $21.05, followed by the top of the Bollinger bands at $21.32, before cracking the latest cycle high. The triple-bottom next target would be $22.00.
XAG/USD Price Action – Hourly chart
XAG/USD Technical Levels